How to Read a SIF Factsheet: Hidden Metrics AMCs Hide

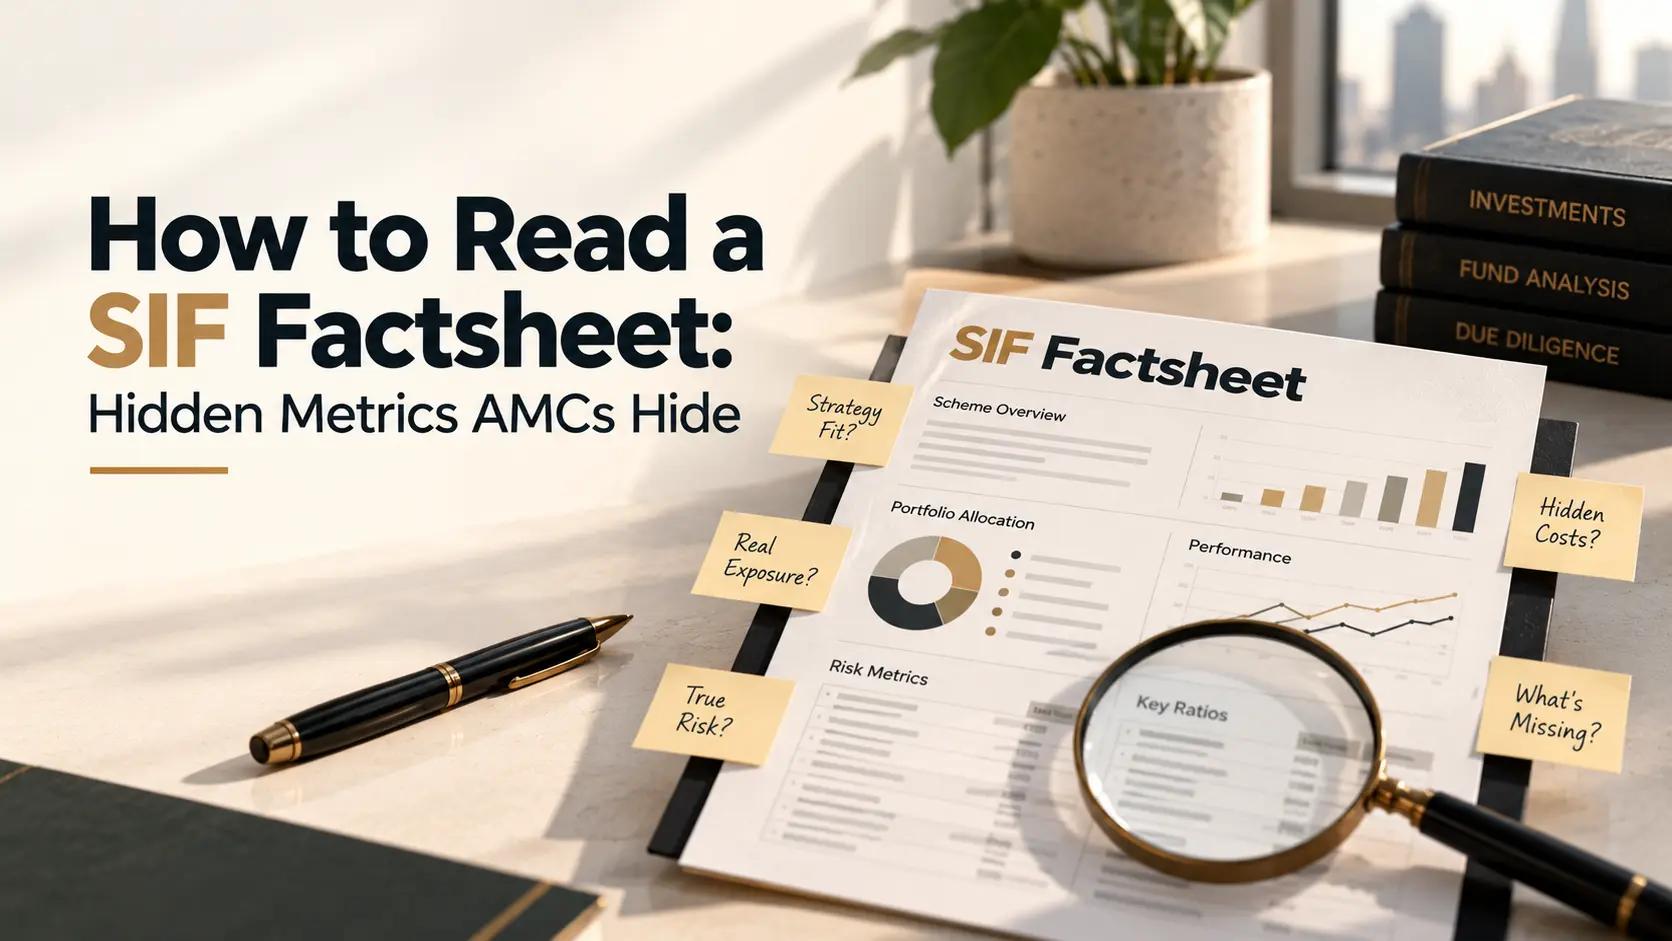
Asset Management Companies design their factsheets to be marketing brochures, not technical manuals.
They want you to look at the shiny 1-year return number on the front page, feel a rush of FOMO, and write the cheque. But if you do not know how to read a SIF factsheet, you are buying a derivative-heavy black box based on a marketing pitch.
If you are deploying Rs 10 Lakhs or more into a Specialized Investment Fund (SIFs), look past the headline. Here are the hidden metrics AMCs don't highlight, and how to read them.
Key Takeaways
- The 1-year return on a SIF factsheet is a marketing trap masking the derivatives strategy's actual volatility.
- Gross-to-Net slippage is hidden friction that shows how efficiently the fund manager executes complex trades.
- Maximum Drawdown is the most critical metric, showing the deepest hole the fund has fallen into during a market correction.
- Unhedged Short Exposure shows exactly how much leverage and derivative risk the fund manager takes to generate alpha.
- The SEBI Risk Band is a regulatory tool that helps you instantly compare the structural risk of different SIF strategies.
Table of Contents
Click to Expand
The 1 Year Return Illusion
Most investors open a factsheet, see a 15 percent 1-year return, and assume the fund is a winner. This is a massive mistake.
A Long Short SIF might generate 15 percent in a raging bull market simply because its long positions flew. But if the fund manager did not actively hedge the downside, that 15 percent return came from taking on massive, unhedged beta risk. When the market reverses, that same fund will collapse 30 percent.
High returns do not mean a good fund. It just means the fund took on high risk.
To understand the different categories available, read our guide on Types of SIF Funds.
Gross to Net Slippage (The Friction Cost)
This is the most hidden metric on the planet. In the derivatives world, the advertised brokerage is irrelevant. The real costs hide in microseconds of execution.
Every SIF factsheet will show a Total Expense Ratio, or TER. But the TER does not capture slippage. Slippage is the difference between the price the algorithm wants to buy and the price it actually fills at.
In an Arbitrage SIF that executes thousands of trades a day, slippage can silently kill performance. Ask your distributor or the AMC for the historical gross-to-net slippage of the specific SIF strategy. If the strategy makes 9 percent gross, but slippage and execution costs eat 2 percent, your net return is 7 percent.
To understand how these strategies are supposed to work, read our guide on SIF Strategies how long-short arbitrage derivatives work.
Maximum Drawdown (The Deepest Hole)
This is the single most important metric on a SIF factsheet.
Maximum Drawdown shows you the largest peak-to-trough loss the fund has ever experienced. If a fund returned 12 percent, but had a maximum drawdown of 25 percent, it means investors watched their capital drop by a quarter.
A good SIF is designed to protect your capital during a crash. If the maximum drawdown exceeds the broader market index, the fund manager is failing at their job. Do not invest in a SIF without checking this number.
Unhedged Short Exposure (The Derivative Leverage)
SEBI permits SIFs to take an unhedged short exposure of up to 25 percent of their net assets. SEBI introduced this under its SIF circular dated February 27, 2025.
But just because a fund can take 25 percent does not mean it always does. Check the factsheet to see the current unhedged short exposure.
If the fund is running a 25 percent short position, it is aggressively betting against the market. If the market suddenly rallies rather than falling, those derivative positions will incur significant losses. You must understand if your fund manager is defensively hedged or aggressively shorting the market.
The Vestbox Case Study: The Drawdown Trap
Let us look at a real-world scenario to see why reading the factsheet matters.
The Client: A 50-year-old business owner who allocated Rs 40 Lakhs to a Multi Asset SIF because the factsheet showed a flashy 18 percent 1-year return.
The Problem: He never checked the Maximum Drawdown metric. Based on Vestbox data, during a sudden mid-cap correction, the fund amplified losses because it was running a massive 24 percent unhedged short exposure. The fund suffered an estimated drawdown of roughly 22 percent. He lost an estimated Rs 8.8 lakh in a matter of weeks.
The Solution: We intercepted the portfolio and redirected his remaining capital into a market-neutral arbitrage SIF. This fund had a lower 1-year return of 8 percent, but a maximum drawdown of only 2 percent. Based on Vestbox data, his portfolio stabilized, and he captured an estimated post-tax return of roughly 7.5 percent annually with near-zero volatility.
He stopped chasing shiny returns and started protecting his capital by reading the hidden metrics.
For a deeper checklist on evaluating these funds, read our guide on: How to choose the right SIF.
Disclaimer: The above scenario is an illustrative study based on expected market behavior and estimated Vestbox data. The figures are approximate and meant strictly for educational purposes to demonstrate portfolio architecture. Actual market returns and fund performance will vary based on real-time conditions.
Frequently Asked Questions
How do you read a SIF factsheet?
To read a SIF factsheet, ignore the 1-year return and focus on the hidden metrics. Check Gross-to-Net slippage for execution efficiency, the Maximum Drawdown for downside risk, and the Unhedged Short Exposure for derivative leverage.
What is the most important metric on a SIF factsheet?
The Maximum Drawdown is the most critical metric. It shows the deepest hole the fund has ever fallen into. If the drawdown exceeds the broader market index, the fund manager is failing to hedge downside risk.
What is Gross-to-Net slippage in a SIF?
Gross-to-net slippage is the hidden friction cost that reveals how efficiently the fund manager executes complex derivative trades. It is the difference between the strategy's gross return and the net return that appears on your dashboard.
What is unhedged short exposure in a SIF?
Unhedged short exposure is the leverage the fund manager uses to bet against the market using derivatives. SEBI permits SIFs to take up to 25 percent unhedged short exposure.
Why should I ignore the 1-year return on a SIF factsheet?
The 1-year return is a marketing trap. A high 1-year return often indicates the fund took on massive, unhedged directional risk during a bull market. It does not reflect how the fund will perform during a market crash.
Where can I find the best SIF funds?
Explore our curated list of SEBI-approved SIFs that meet strict quality checks in our guide at Best SIF Funds in India. If you are ready to deploy your capital, you can Invest in SIF Funds using our Vestbox Smartphone App.
“Want the full overview of SIFs, regulations, and benefits? Explore the complete guide: What is a SIF Fund (Specialized Investment Fund)? How do SIFs work?“
Ready to explore?
SEBI-regulated long-short and hedging strategies designed to capture opportunities in all market conditions.
Disclaimer
Mutual fund investments are subject to market risks. Read all scheme-related documents carefully. Please consult a certified financial advisor before making any investment decisions.
Trust & Compliance
This article has been created following our strict Editorial Policy. We believe in complete transparency regarding how we operate; you can read our Disclosures. For legal liabilities and risk factors, please review our Disclaimer.