The Truth About SIF Returns: Volatility, Drawdowns & Crashes

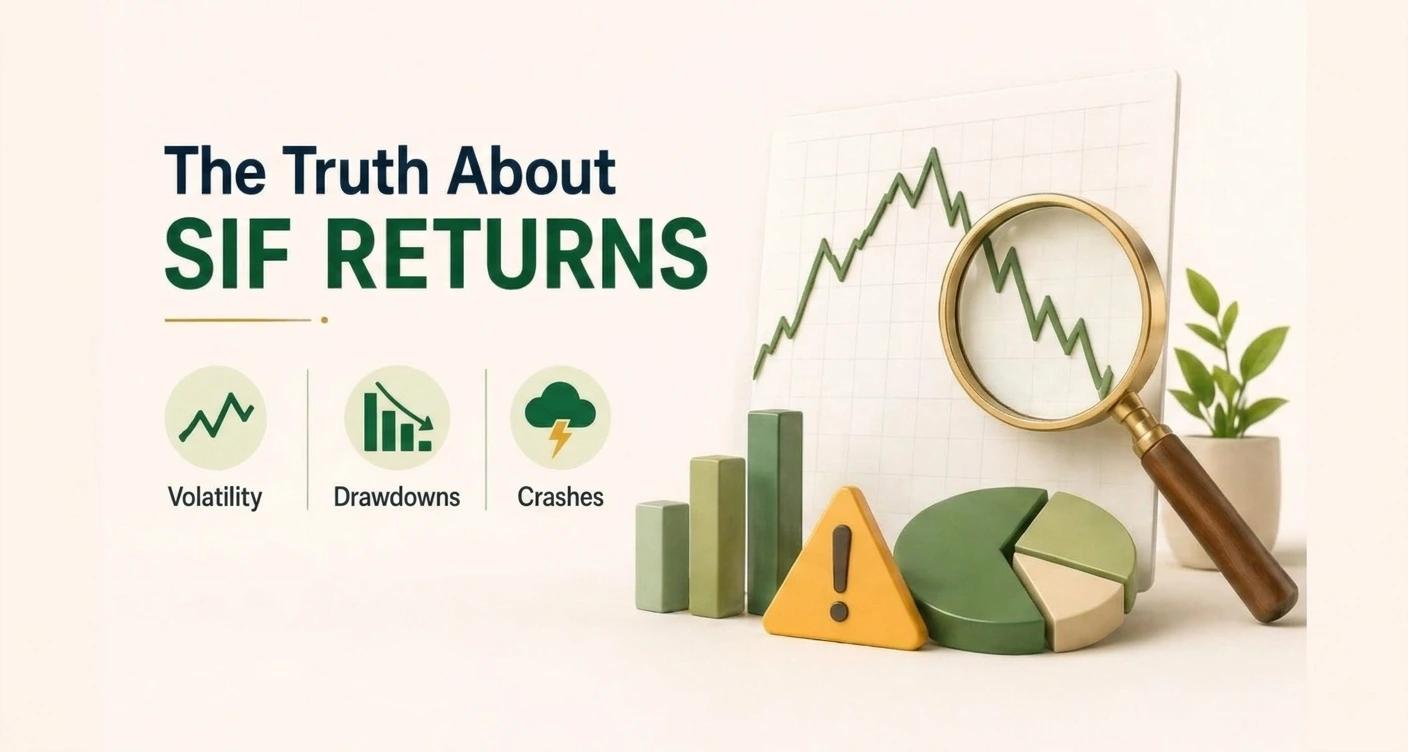
Table of Contents
Click to Expand
- Ditching the "Relative Outperformance" Lie
- What Returns Can You Realistically Expect?
- Understanding Risk-Adjusted Returns (Sharpe/Sortino)
- The Brutal Trade-Off: Bull vs Bear Market Behavior
- How SIFs Actually Behave During Market Crashes
- The Benchmarking Trap: Stop Comparing Apples to Oranges
- The Vestbox Reality: The Psychology of Drawdowns
Ditching the "Relative Outperformance" Lie
"Sir, our fund fell only 12% this quarter, while the Nifty fell 15%. We outperformed!"
If a wealth manager ever says this to you as a victory, fire them. Immediately.
In absolute terms, you still lost 12% of your hard-earned money. This is the sick, accepted joke of "relative outperformance" in the standard mutual fund industry. They measure success by losing less money than the index.
To Explore and Invest in SIF strategies is to demand a completely different paradigm. It is the demand for absolute returns of positive numbers on your screen, regardless of what the Nifty 50 does. But to invest in SIFs successfully, you must set aside your expectations of sudden wealth and understand the brutal, mathematical reality of how risk and returns interact.
What Returns Can You Realistically Expect?
Let’s kill the hype. SIFs are not magic. They are mathematical risk-management tools.
If you are expecting a Long/Short SIF to deliver 30% CAGR, you are going to be deeply disappointed—and you fundamentally misunderstand the product.
Here is the realistic baseline for modern SIF architectures:
- Long/Short Equity SIFs: Typically target 12% to 15% CAGR over a full market cycle (3-5 years).
- Market-Neutral Arbitrage SIFs: Typically target 8% to 9% CAGR, serving as a high-yield alternative to Fixed Deposits with equity-taxation benefits.
Why not higher? Because downside protection costs money. Buying put options to act as an airbag against a crash requires paying a premium. That premium acts as a slight drag on your returns during bull markets. You are willingly trading explosive upside for a guaranteed ceiling on your downside.
SIFs use advanced tools like hedging and long-short positioning. To understand the exact mechanics of how fund managers execute this, read our deep dive on How Long-Short & Arbitrage Strategies Work.
Understanding Risk-Adjusted Returns (Sharpe/Sortino)
Smart investors don't just look at the final return percentage. They look at how much sleep they lost to get that return. Risk-adjusted metrics measure this.
Forget the complex math. Understand the concepts:
- The Sharpe Ratio: Measures how much return you generated per unit of total volatility (ups and downs).
- The Sortino Ratio: Measures how much return you generated for every unit of downside volatility (only the drops).
Why Sortino is the only metric that matters for SIFs:
Imagine a mutual fund that jumps 40% one year, drops 35% the next, and averages 10% over three years. It has a terrible Sortino ratio.
A SIF that delivers 9%, then 11%, then 10%, has an incredible Sortino ratio. It didn't make you rich quickly, but it compounded your wealth smoothly without giving you a heart attack.
The Brutal Trade-Off: Bull vs. Bear Behavior
This is where most new SIF investors break. They invest ₹20 Lakhs, watch the Nifty rally 20% during a massive bull run, and then get furious when their SIF returns only 12%. They think the fund is failing.
Reality check: The fund is doing exactly what it was built to do.
In a raging bull market, a standard mutual fund is like a convertible car with the top down and maximum exposure to the sun. A SIF is a car with the windows up and the airbags armed. Of course, the convertible feels faster. But what happens when it starts raining?
If you cannot handle the psychological pain of underperforming a bull market, a SIF is not for you. You must possess the emotional maturity to accept lower highs in exchange for the guarantee of higher lows.
How SIFs Actually Behave During Market Crashes
This is where the SIF architecture justifies its existence.
When the broader market enters a freefall, panic spikes. You can literally measure this fear using the India VIX index data (the volatility index). Standard funds bleed because they are 100% exposed to the downside. SIFs behave differently based on their strategy:
- Long/Short SIFs (The Airbag): When the market drops, the short positions in the portfolio surge in value, offsetting the losses of the long stocks. Vestbox data from recent geopolitical panic sell-offs shows well-structured long/short funds capping their drawdowns at 3-5% while the broader index bled 12-15%.
- Market-Neutral SIFs (The Teflon): Because they hold no directional equity risk, they are almost entirely blind to market crashes. They continue to extract their cash-futures arbitrage spreads as if nothing happened.
The Benchmarking Trap
If you benchmark a SIF against the Nifty 50, you are making an intellectual error. You are comparing a defensive architecture to an offensive one. It’s like judging a goalkeeper based on how many goals he scored.
How to properly benchmark a SIF:
- Long/Short SIFs: Should be benchmarked against the Crisil Composite Bond Index + a 34% premium, or the Nifty 50 Minimum Volatility Index. You are paying for downside protection; judge them against safe assets, not aggressive ones.
- Arbitrage SIFs: Should be benchmarked against the 3-year FD rate of top banks. If the SIF yields 9% while the FD yields 7% and has better tax efficiency, it is a massive win.
The Vestbox Reality: The Psychology of Drawdowns
Let’s look at a psychological case study from the Vestbox desk.
A client moved ₹50 Lakhs into a Long/Short SIF. Six months later, the Nifty was up 15%. His SIF was up 8%. He called, frustrated, demanding to switch back to an index fund.
We advised against it, explaining the structural trade-off. Three months later, a global macro shock hit. The Nifty crashed 12% in a month. The client’s old index fund friends were panicking. His SIF? It dropped 1.5% and recovered to its peak NAV in just six weeks.
Because his drawdown was mathematically shallow, he didn't panic-sell. Because he didn't panic-sell, he stayed compounding.
In investing, avoiding a 30% drawdown is mathematically more powerful than catching a 30% rally. If you lose 30%, you need a 43% gain to break even. SIFs prevent you from falling into that mathematical hole.
Stop measuring your wealth against the market's manic mood swings. Start measuring it by how peacefully it compounds.
Understand the core mechanics of SIFs to know why returns behave this way? Explore the complete guide to Specialized Investment Funds (SIF).
Disclaimer
Mutual fund investments are subject to market risks. Read all scheme-related documents carefully. Please consult a certified financial advisor before making any investment decisions.
Trust & Compliance
This article has been created following our strict Editorial Policy. We believe in complete transparency regarding how we operate; you can read our Disclosures. For legal liabilities and risk factors, please review our Disclaimer.
Share & Save Article
Other Posts
What is Portfolio at Risk? A Complete Guide to Meaning, Formula, Calculation, & Benefits.
Jun 5, 2026

What is SIP & How Does It Actually Work?
May 27, 2026

What is an AMC in Mutual Funds? Understanding Asset Management Companies
May 27, 2026

How PMS Works: A Complete Guide to Construction, Monitoring, and Reporting
May 27, 2026